

So, as it's usual, the Steam team has shared a blogpost with some figures about the performance of the games released last year in the platform and seems to be a good sign that tools (from Labs, new algorithms, etc...) might be working better than ever so this is helping games to reach more potential audiences, let's see what the team has shared and then we can discuss it. shall we?
We are constantly examining how the growth of Steam affects new titles and what it means for developers. Usually, our own internal questions mirror those of many in the development community.
In an effort to share some of our findings, we've put together the following post on how new releases have been performing. We're hoping this information is useful to developers, and we're interested in hearing whether more data-driven reports like these would be helpful to your product planning and development. And, if yes, what other topics would be of value. Read on, and please let us know what you think here in the Steamworks discussions.
The TL;DR
Here's a summary of what we found:
- Over the years, there's been a continuous increase in the number of games achieving success on Steam. We'll dig into this in the first section below.
- Earnings prospects for most - but not all - games improved in 2019. We'll dig into this in the second section below.
Some Background
A bit of history and context is helpful for understanding the analysis that follows. Prior to 2012, games that released on Steam were hand-picked by employees here at Valve. We realized that we were probably getting in the way of success for a lot of innovative games, and players were demanding more diversity in the kinds of games available via Steam. So, in 2012, we officially launched Steam Greenlight to allow players to vote on the games that would be released. Initially, we were only able to accept a small number of top-voted games per month. Then, in August 2013, our launch capacity improved with the introduction of some new internal tools, and for every month thereafter we accepted batches of at least 100 games. In June 2017, we launched Steam Direct with the intention of making the process of bringing a game to Steam more streamlined, transparent, and accessible.
Opening the platform resulted in a large number of new titles releasing on Steam, reflecting a diversity of niches and players we couldn't have dreamed of. Creating robust discoverability tools and systems was, and still is, crucial to ensuring that games will be surfaced to the customers who will want to play them, and we are continually experimenting with improvements to these systems.
So, has all of this been working? For whom? Read on for details.
More new releases than ever are finding success
One of our goals is to be a platform where great games can realize success. So a natural place to start this analysis was to ask: Are more games finding success? Of course, "success" is different for each developer, so we looked at several different benchmarks of success in this analysis.
Regardless of how we defined success, though, we found that an increasing number of games were achieving it.
As a first pass, we tallied the number of games earning over USD$10,000 in the first two weeks after release each year. For reference, most recent games earning around $10,000 in the first two weeks earned between $20,000 and $60,000 over the course of 12 months following release. We looked at the first two weeks of earnings to give even weight to games released across the year, and because initial earnings are a key metric that we hear many developers using in conversation. We also decided to study "paid games" (games with an up-front price tag) and save free-to-play games for another study, since initial earnings probably aren't the right metric for the success of free-to-play games. (For more on the reasoning behind our analysis choices, plus additional charts that use alternate success metrics, see our research appendix.)
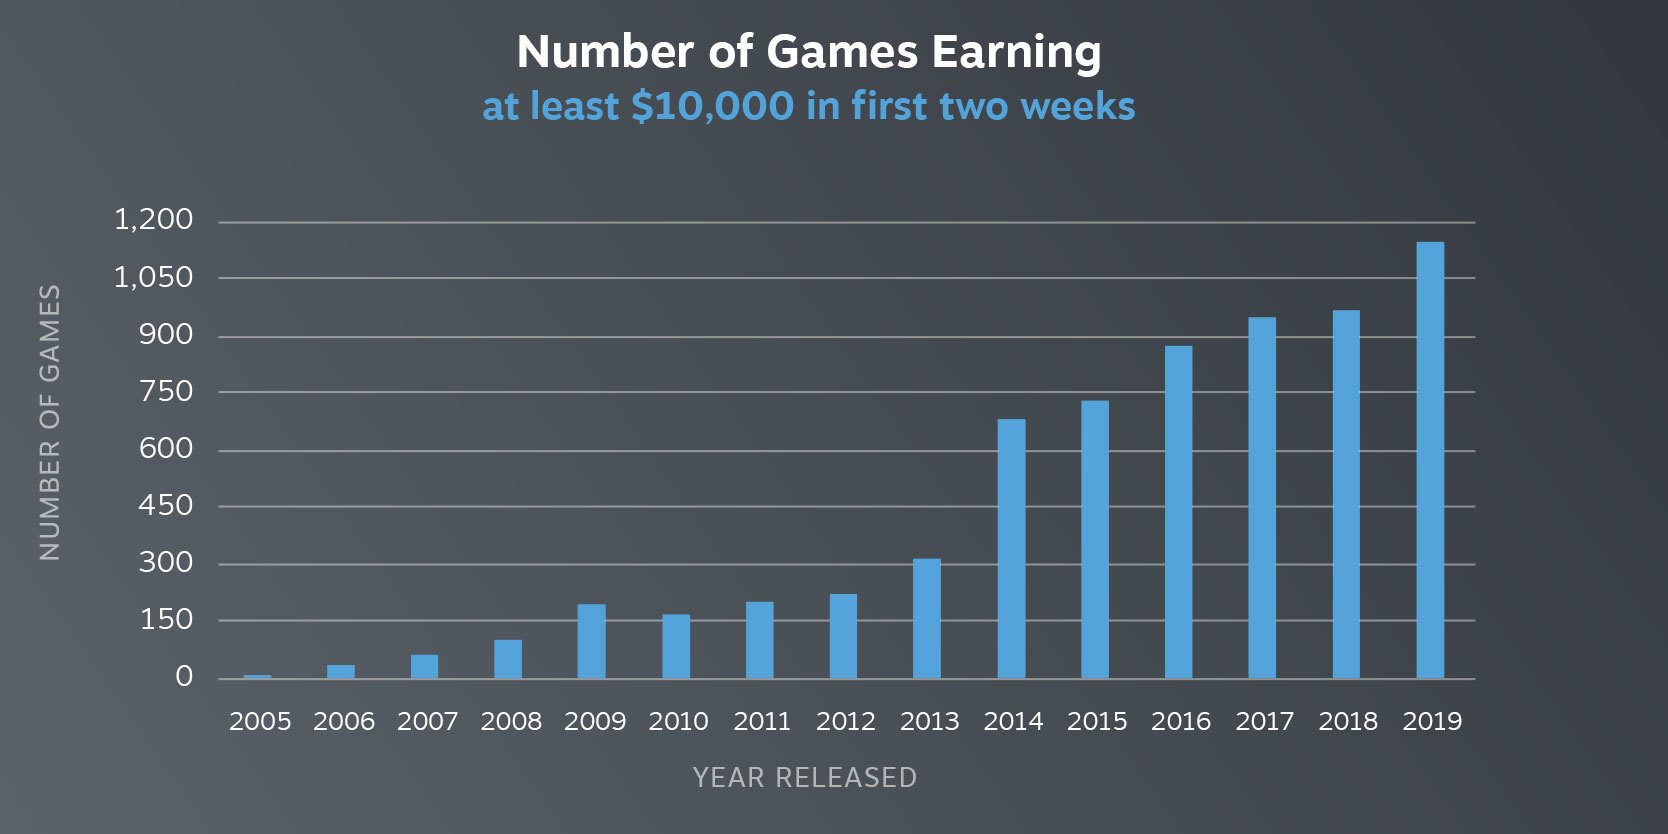
As the graph shows, the number of games meeting this success measure has increased pretty consistently over time, with an 18% increase in 2019 compared to 2018. That increase wasn't just due to a larger number of games on the platform - the proportion of games meeting success increased by 11% in 2019.
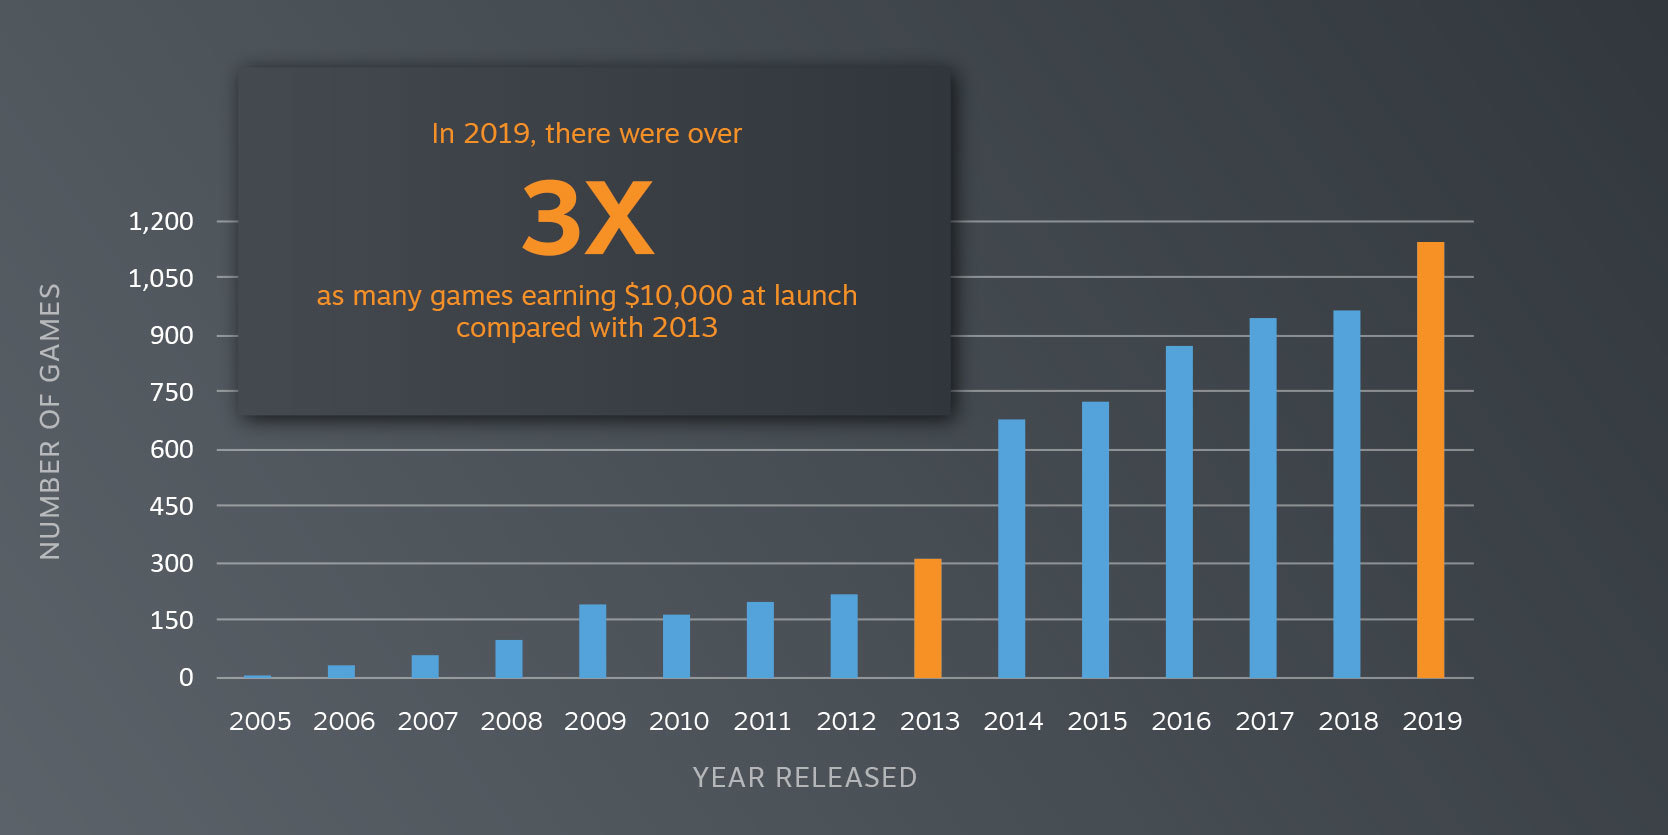
You may also notice a jump on the graph between 2013 and 2014. That reflects the increase in the number of games we accepted to Steam beginning in August 2013. Many of these games weren't immediately ready for release, so the effect of that increase only really shows up in 2014. By 2019, more than three times as many new releases met the $10k benchmark than in 2013.
Many recent successes would never have previously been on the platform
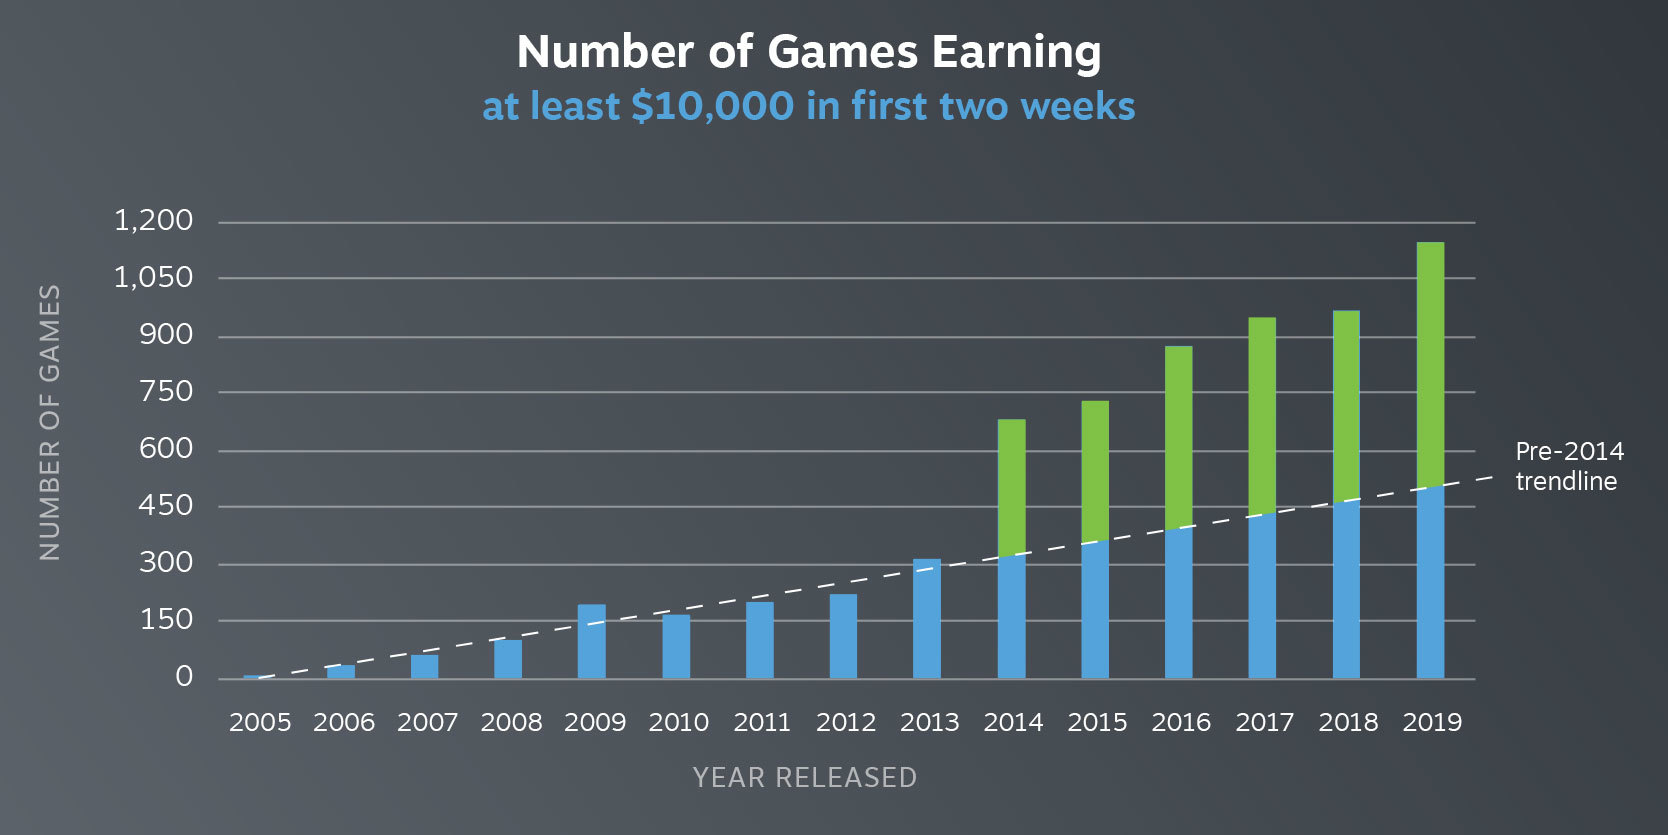
As mentioned above, we opened the platform because we believed that "hand curating" the titles released on Steam had led to some great titles being missed. To test this, let's suppose we had never opened the platform. The dashed line in the graph below estimates what the trend would have looked like if we hadn't increased the quantity of games accepted to the platform in mid-2013. Assuming the trend was stable, it suggests that opening the platform more than doubled the number of releases meeting the $10K benchmark each year. While we can't say for sure, we think the green portions of the bars above the dashed line are, largely, games that would never have previously found success on Steam... because they never would have been released on the platform at all.
The $10k threshold was a fairly arbitrary starting point, and to make sure this analysis wasn't a fluke, we also tested higher and lower cutoffs and different time ranges. We found similar patterns in all cases. For example, we see more than 4 times the number of games earning over $5,000 in the first two weeks in 2019 vs 2013, and more than 3 times the number of releases earning over $250,000. You can find graphs for these and other benchmarks in our research appendix.
Most games did better in 2019 vs 2018
We were encouraged by the results above - there are more hits than ever these days, and it looks like our decision to open the platform helped that happen. But we also wanted to study how releases across the distribution – such as the median release, the 25th percentile release, and the 75th percentile release – were doing. (The 'median release' is the game that half the releases did better than and half the releases did worse than. You could also call it the '50th percentile release.')
How we studied median and percentile growth
When running these numbers, we were initially tempted to compare the median and percentile results from 2019 to all previous years. However, we noticed that the median game in 2019 was a very different kind of game than the median game in, say, 2013. And the same was true for the 25th percentile game. We realized the composition of games on Steam had changed so much between different release policies that a full historical comparison was meaningless. (See our research appendix for more on how we reached that conclusion.)
Instead, we compared 2019 to 2018, isolating the comparison to the first full year of Steam Direct. This comparison allowed us to more accurately see how the market on Steam is settling into the new policy. Additionally, we made several changes to our discoverability systems in 2019 in the hopes of better matching games to customers who would want them, and this comparison gives us some insight into whether those changes are working.
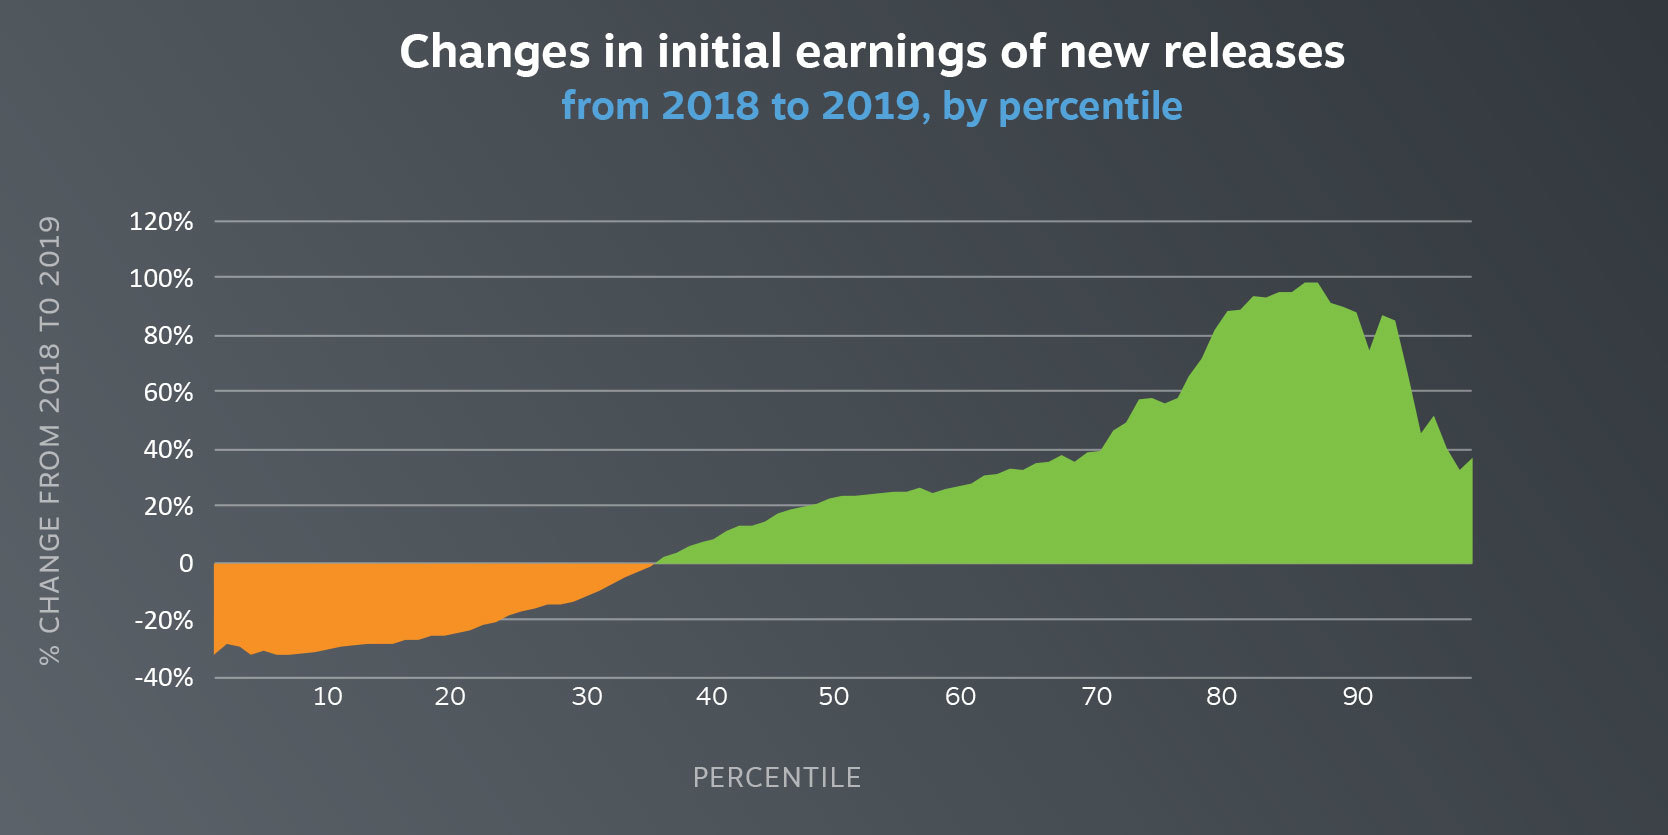
First, we looked at changes in median earnings. We found that the median game released in 2019 earned 24% more during its first two weeks of sales than the median release in 2018.
Next, we looked at percentiles other than the median. Here, the news was more mixed. On the upside, the 75th percentile release (meaning the release earning more than 75% of new releases in each year, but less than 25% of new releases) earned 56% more in its first two weeks in 2019 vs. 2018. However, the 25th percentile release earned 17% less.
More generally, we found that releases above the 35th percentile earned more money in 2019 vs. 2018, and releases below the 35th percentile earned less.
We want to make sure we aren't standing in the way of games' successes, so we plan to take a closer look at everything that contributed to these results.
What's next
We hope this study was helpful and gives more insight on the impacts of Steam's growth on new releases, both recently and over the years. We know there's more work to be done to help developers find success on Steam, and there's a lot more to be studied.
We’d like to get your input on what other analyses might help you better understand the landscape. Let us know your thoughts and suggestions here in the Steamworks discussions.
Note: If you're interested in a look at our methodology and some more detailed graphs, please see our research appendix.
-The Steam Team
Steam :: Steamworks Development :: Data Deep Dive: How are new releases on Steam performing?
We are constantly examining how the growth of Steam affects new titles and what it means for developers. Usually, our own internal questions mirror those of many in the development community. In an effort to share some of our findings, we've put together the following post on how new releases...
Now, as we can see more and more games seem to have benefited from the tool changes compared to previous years and while official figures will always lack from some points (as Valve is not allowed to share figures from third partners due to contracts and such) it is great to see that the changes they did are working well.
What do you think about this changes and the results? let's talk about them.